-
Inventory
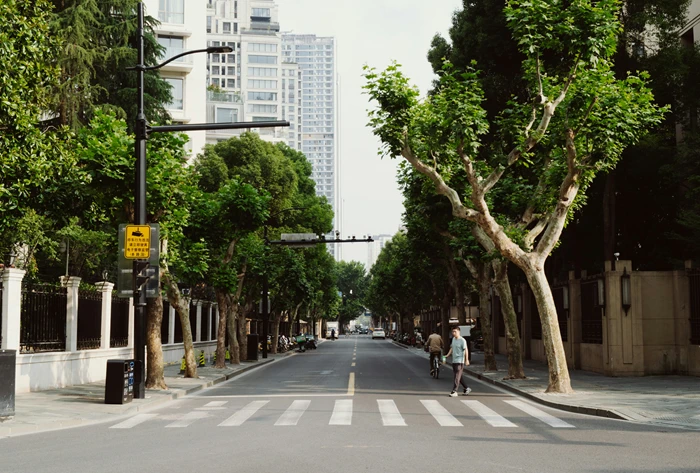
Inventory update
Through semantic segmentation and LiDAR data integration, we automatically identify and characterize urban trees, estimating crown diameter and height to facilitate the updating of the municipal inventory.
-
Prediction
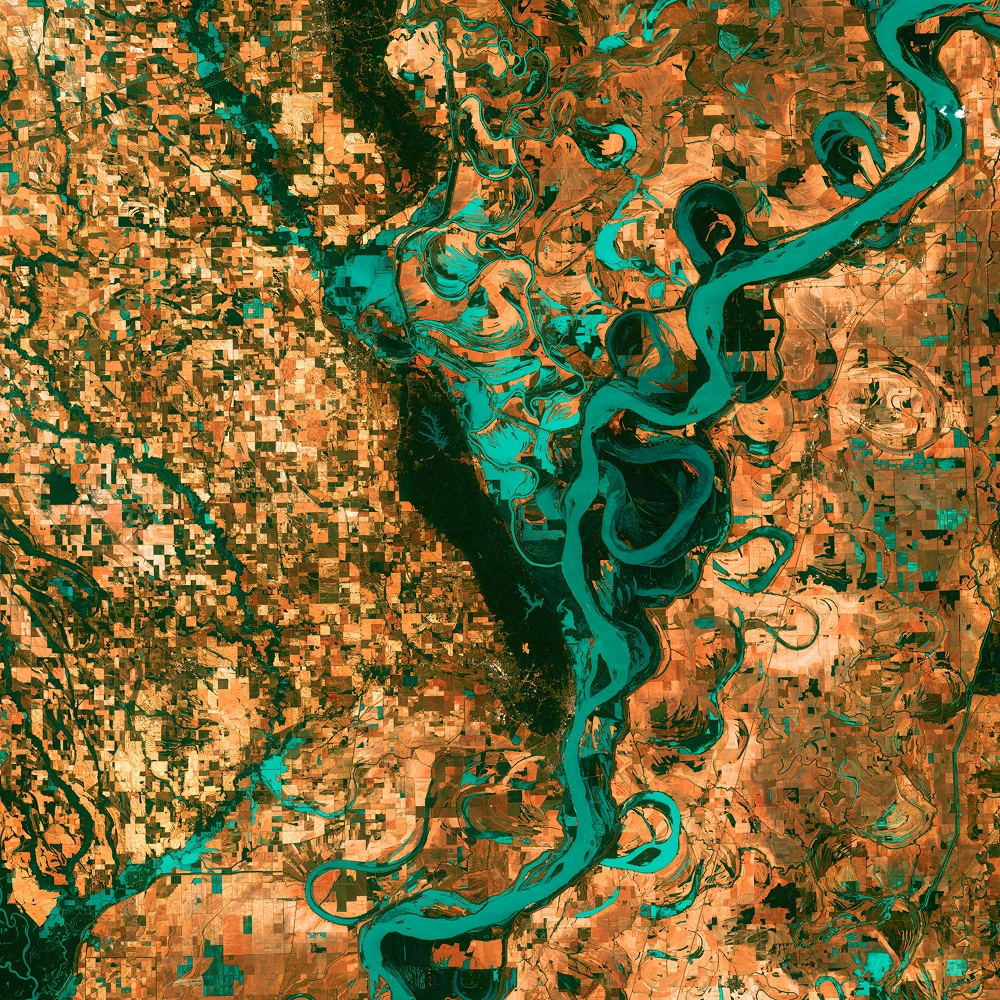
Risk prediction
We apply satellite analysis and time series, identify early signs of stress and anomalies in urban trees, generating dynamic risk maps that allow us to prioritize maintenance and predict risks.
-

Monitoring
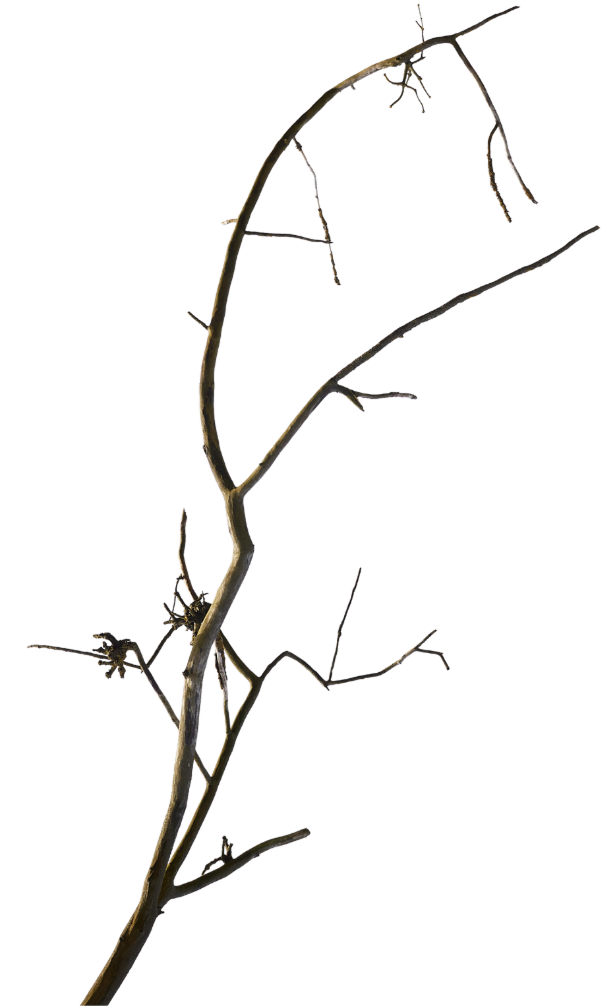
Tree monitoring
High-frequency satellite images to continuously monitor urban trees, detecting dead trees, abnormal growth, and evaluating the effectiveness of actions, with a comprehensive and up-to-date overview.
-
Irrigation
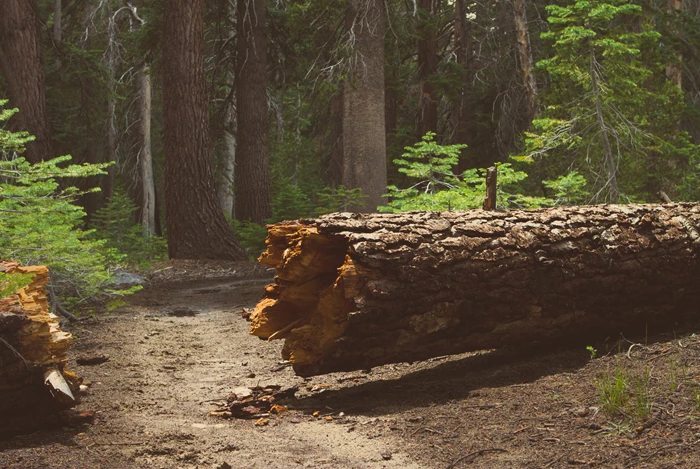
Precision irrigation
We identify the actual water needs of urban trees, isolating the crown of each specimen using semantic segmentation to estimate its stress level and enable precision irrigation that optimizes maintenance.